Budget deficits, government debt and fiscal sustainability in South Africa
Whether
the federal government’s budget is fiscally sustainable or not is generally
measured by the annual in the ratio of debt held by the public to GDP (Levit
2011). This is known as the debt-to-GDP ratio. Budget deficits
will generally increase the level of total government debt. Temporary increases
in the debt-to-GDP are not necessarily problematic. However, if the debt to GDP
ratio is persistently rising, it is considered unsustainable. If GDP growth
equals or exceeds the annual budget deficits as a percentage of GDP, meaning
that the debt to GDP ratio would generally remain constant or fall, then the
budget is considered sustainable. While there is no level of debt to GDP that
is universally regarded as optimal, some budget reform proposals recommended
maintaining the debt to GDP ratio at 60% or less going forward.
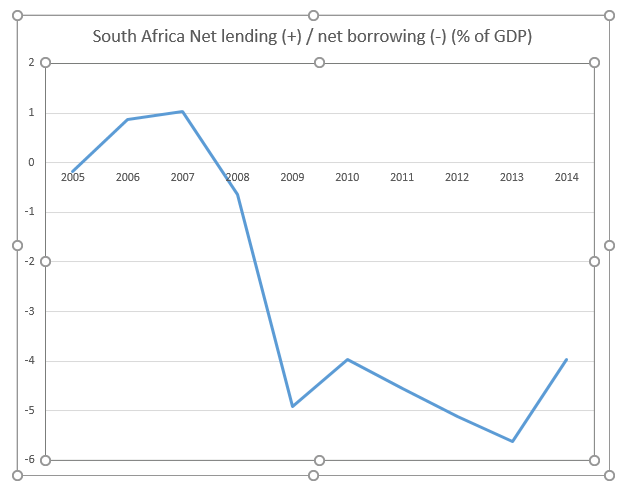
Net
Lending (+) and net borrowing (-) (% of GDP)
South Africa’s net lending as a percentage of GDP was
almost one between 2006 and 2007. It then fell sharply from 2008 to 2014. It actually
became a deficit of around -6%. This shows that the deficit ballooned over the
period. This sharp decline in net lending was brought about by the 2008/2009
global financial crisis. However, it continued to decline even way after the
financial crisis. This is shown in the figure below:
Debt
service on external debt
Over the period 2006 to 2016, South Africa’s debt
service costs generally rose with the peak being reached between 2012 and 2013.
Algeria’s servicing costs fell to almost zero between 2006 and 2007 and have
remained at that level for the whole period. Nigeria and Egypt also had very
low and stable debt servicing costs. This is despite the fact that Egypt was
going through a revolution. Overally, South Africa’s debt servicing costs are
higher than that of its counterparts. This is shown in the figure below:


GDP
Growth Rate
Since GDP is the yardstick that is
normally used to ascertain the economic growth trajectory of an economy, there
is need to look at the GDP growth rate of South Africa and that of its
counterparts. Only Algeria had a positive GDP growth rate over the period which
rose from slightly below 2% to almost 4%. South Africa’s GDP growth rate fell
from about 8% in 2006 to slightly above 2% in 2015. This also shows that the
growing budget deficit is consistent with a falling GDP. This is shown in the
figure below:

Inflation
Since
economists who hold the Ricardian view insists that budget deficits are linked
to a rise in inflation as the government may need to print more money to fund
the deficit, there is need to also analyse inflation rates. Nigeria had the
most fluctuations in inflation. The inflation rates for South Africa actually
fell during the period. In this case there is no evidence to suggest a causal
link between the country’s budget deficit and inflation. The findings are shown
in the following table and graph:
Inflation,
GDP deflator (annual %)
2006
|
2007
|
2008
|
2009
|
2010
|
2011
|
2012
|
2013
|
2014
|
2015
|
|
South Africa
|
6.2741538
|
8.8492898
|
8.8315689
|
7.5045113
|
6.3510265
|
6.532211
|
5.2866962
|
6.5876164
|
5.7012726
|
3.9568974
|
Nigeria
|
17.337782
|
4.7707422
|
10.835298
|
-4.3205733
|
103.8228
|
9.5100963
|
9.2712447
|
5.8732956
|
4.6626237
|
2.8636644
|
Algeria
|
10.546696
|
6.3953443
|
15.310571
|
-11.161609
|
16.119976
|
18.228012
|
7.4523735
|
-0.1122779
|
-0.4120846
|
-6.024195
|
Egypt,Arab Rep.
|
7.3608596
|
12.595542
|
12.208417
|
11.172961
|
10.115357
|
11.605866
|
18.228899
|
9.0038427
|
11.512876
|
10.940663
|

Debt
to GDP ratio
South Africa’s debt to GDP ratio
rose from 23.3% in 2007/2008 to almost 50% in 2016. The debt growth is
worrisome as this may make it unsustainable for the government as it has to
meet rising debt servicing costs. But since some economists argue that a debt
to GDP ratio of 60% or less is regarded as optimal, there may be no need to
worry if the government maintains it at a level below 60%. The data is shown in
the table below:

South Africa’s real GDP growth has
been falling since 2007/08 from 4.6% to 2% in 2014 whilst the debt as
percentage of GDP has been increasing from 23.3% in 2007/08 to 39.7% in 2013/14
fiscal year. The trend is government debt has been increasing due to deficits
whilst economic growth has been falling.
Conclusions
The running of a budget deficit by South Africa during
the 2008 global financial crisis was justifiable. It is reasonable to allow a
budget deficit during a temporary downturn in economic activity. During that
period the South African economy was negatively affected and the government had
to increase its spending in order to stimulate aggregate demand.
It can be concluded that South Africa’s persistently
rising budget deficits may raise a red flag to investors of an existing or
pending ‘fiscal crisis’. If South Africa continues to fund its budget deficit
with debt stock which surpasses the growth in output and income, investors will
then require to be paid a higher rate of interest. They will need compensation
to counter the risk that they might not be paid or that the value of their
securities would be eroded by inflation (which has risen from 4.82% in 2006 to
7.07% in 2016). Other countries experiences, like Zimbabwe for instance as
highlighted by Makochekanwa (2008), suggest that a loss of investor confidence
can arise abruptly during periods of budget deficits or uncertainty.
South African budget deficits are not going to be sustainable
in the long run because of the nature of the expenditure such as social
services which account for R884 billion which is almost half of the total
budget. A high percentage of the budget should go towards investment such as
agriculture, mining etc. and not financing state enterprises that are loss
making.


Comments
Post a Comment